The Definitive Guide to Smart Energy Monitors: Technology, ROI
The modern residence has evolved into a complex electrical ecosystem, yet for decades, the primary interface between the consumer and their energy consumption remained a monthly, retrospective utility bill. This informational asymmetry created a “black box” effect, where the specific drivers of cost and carbon footprint were obscured by aggregate data. Smart Energy Monitors. The transition toward energy sovereignty requires a fundamental shift in how we observe power—moving from a model of passive consumption to one of active, real-time telemetry.
This shift is facilitated by a class of high-resolution diagnostic tools that sit at the intersection of electrical engineering and data science. These systems do not merely measure current; they decode the “electrical signatures” of individual appliances, providing a digital transcript of a building’s metabolic activity. As utility grids transition toward variable pricing and decentralized renewable inputs, the ability to see and react to energy demand in milliseconds becomes a prerequisite for both economic resilience and environmental stewardship.
Navigating the landscape of modern energy observation requires an understanding of more than just hardware installation. It involves a deep dive into Non-Intrusive Load Monitoring (NILM), the nuances of electromagnetic induction, and the privacy implications of high-frequency data sampling. To deploy these systems effectively is to transform the home from a silent consumer into a responsive node in a larger, smarter grid. This article serves as an analytical foundation for those seeking to master the complexities of high-resolution energy management.
Understanding “Smart Energy Monitors”
A smart energy monitor is a high-fidelity data acquisition system designed to provide real-time visibility into electrical consumption. Unlike the utility-owned “smart meter” installed at the service entrance—which primarily serves the billing interests of the provider—user-centric “Smart Energy Monitors” focus on granular attribution. They utilize Current Transformers (CT) clamped around the main service conductors to measure the magnetic fields generated by flowing current, often sampling at rates exceeding several kilohertz to identify the unique “noise” created by different mechanical and electronic loads.
Multi-perspective explanation of these systems requires acknowledging that they are as much software platforms as they are electrical components. From a hardware perspective, they are sensors; from a behavioral perspective, they are feedback loops. A common misunderstanding is the belief that these monitors automatically “save” energy. In reality, they are purely diagnostic. The savings are a secondary effect of human or automated intervention based on the data provided. Without a strategy for adaptation, the monitor is simply a high-tech record of inefficiency.
Oversimplification risks often center on the “plug-and-play” narrative. While consumer-grade units have become more accessible, the accuracy of their appliance recognition—the process of NILM—is rarely absolute. Factors such as “background noise” from variable-speed motors or the presence of numerous similar electronic switch-mode power supplies can lead to misattribution. Understanding these systems means accepting the probabilistic nature of their insights rather than expecting the binary certainty of a laboratory instrument.
Deep Contextual Background
The trajectory of energy monitoring has moved from the mechanical to the mathematical. The original induction disk meters, patented by Galileo Ferraris and Oliver Shallenberger in the late 19th century, were marvels of physical integration, where the speed of a spinning aluminum disk was directly proportional to the power consumed. These were robust but opaque, offering no insight into when or how energy was used, only how much.
The systemic evolution accelerated with the deregulation of energy markets and the advent of the “Internet of Things” (IoT). The first generation of home monitors utilized simple optical sensors that “read” the pulses of utility meters. However, the true breakthrough came with the miniaturization of digital signal processors (DSPs) capable of performing Fast Fourier Transforms (FFT) on electrical waveforms. This allowed monitors to move inside the breaker panel, shifting the focus from the total household load to the individual harmonic signatures of a refrigerator compressor versus a toaster heating element.
Conceptual Frameworks and Mental Models
To effectively interpret high-resolution energy data, one must adopt specific analytical lenses:
-
The Electrical Signature (Fingerprinting): View each appliance not as a static load, but as a unique waveform. A motor starting up has a massive inrush current followed by a steady state, creating a “fingerprint” that software can recognize. This framework moves the user from seeing “total watts” to seeing “active devices.”
-
The Baseload/Vampire Load Framework: Visualize the house as having a “resting heart rate.” This is the energy consumed by always-on devices (routers, standby LEDs, clocks). Reducing this baseload is often the highest-impact strategy for long-term savings.
-
The Intermittency Buffer: In homes with solar or wind, the monitor acts as a “balance of trade” tracker. This mental model focuses on the “net” flow, helping users synchronize high-demand tasks (like laundry) with peak production periods.
Key Categories and Technical Variations
Monitoring solutions vary significantly in their installation complexity and data granularity.
| Category | Connection Type | Granularity | Ideal Use Case |
| CT-Clamp (Mains) | Non-invasive (Panel) | Total house + NILM | General residential awareness |
| Circuit-Level (Multi-CT) | Invasive (Breaker) | Direct by circuit | High-accuracy attribution; large homes |
| Plug-In (Smart Plug) | Outlet-based | Individual device | Temporary audits; small appliances |
| Optical/Pulse Reader | Utility Meter Cover | Total house only | Renters; non-invasive requirements |
| Utility Integration | Software/API | 15-60 min intervals | Basic budgeting; no hardware install |
Realistic Decision Logic
The decision to invest in circuit-level monitoring versus total-house NILM depends on the “complexity of the load.” A home with a simple resistive heating system and few electronics will see high accuracy with a basic two-clamp NILM monitor. However, a modern “smart home” with multiple inverter-driven HVAC units and complex LED dimming circuits will likely require direct circuit-level monitoring to avoid the misattribution errors inherent in NILM software.
Detailed Real-World Scenarios Smart Energy Monitors
Scenario 1: The Failing Bearing Detection
A “Smart Energy Monitor” detects that the refrigerator is running for 45 minutes every hour, compared to its historical 20-minute cycle. Furthermore, the power draw has increased by 15%. This scenario illustrates the monitor as a “preventative maintenance” tool. The user identifies a failing compressor before it spoils the food or causes a catastrophic electrical fault.
Scenario 2: Solar Curtailment Management
On a sunny day, a home’s solar array produces more than the house consumes, but the utility limits exports to the grid. The monitor triggers a “smart” water heater to kick in, essentially “storing” the excess solar energy as thermal energy. This demonstrates the transition from a monitor to an orchestrator.
Scenario 3: The “Vampire Load” Audit
A user discovers their baseload is a constant 400 watts. Through the monitor’s real-time feedback, they unplug a 15-year-old plasma TV in a guest room and a legacy audio receiver, instantly dropping the baseload to 150 watts. The second-order effect is a cooler room and reduced stress on the local circuits.
Planning, Cost, and Resource Dynamics
The implementation of “Smart Energy Monitors” requires an assessment of both hardware CAPEX and the “time-cost” of data engagement.
| Expense Item | Estimated Range (USD) | Variability Factors |
| Hardware Unit | $150 – $800 | Number of CT clamps; processing power |
| Professional Electrician | $150 – $500 | Panel accessibility; local labor rates |
| Subscription Fees | $0 – $120/year | Advanced analytics; cloud storage |
| Integration Hardware | $50 – $200 | Smart plugs; Zigbee/Z-Wave bridges |
Opportunity Cost: The primary resource required for success is not money, but “attention.” Data without analysis is overhead. If a user is not willing to spend one hour per month reviewing patterns and adjusting behavior, the system’s ROI remains theoretical.
Tools, Strategies, and Support Systems
-
NILM Algorithms: The proprietary software that disaggregates the total load into specific appliances.
-
Harmonic Analysis: High-end tools that look for distortions in the 60Hz sine wave to identify “dirty” power or failing equipment.
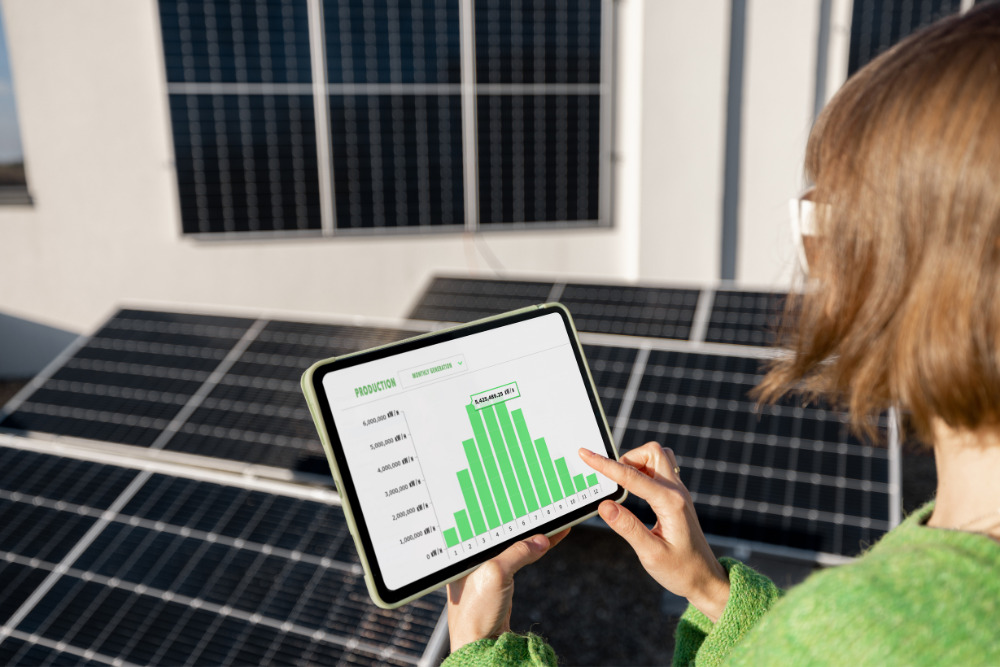
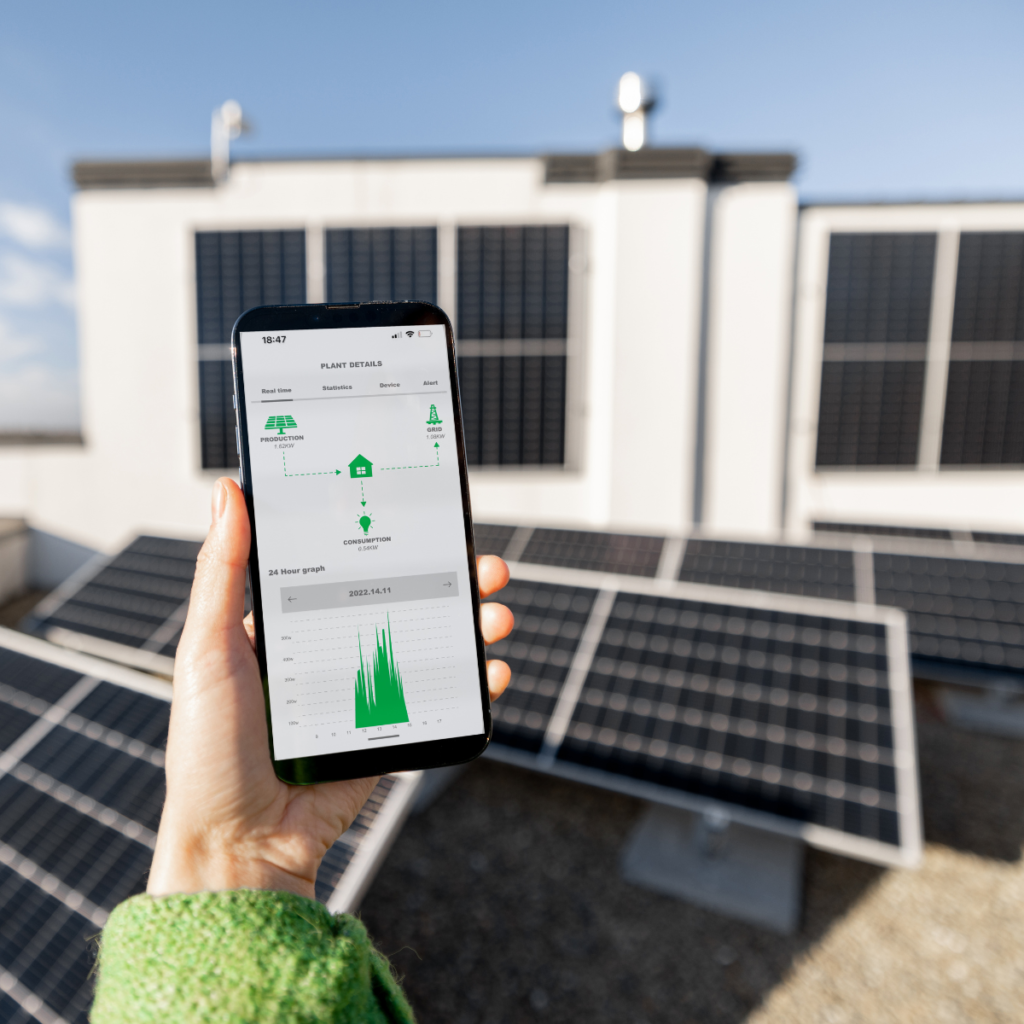
-
Real-Time Dashboards: Mobile and desktop interfaces that provide the “feedback loop” necessary for behavioral change.
-
IFTTT/Automation Links: Allowing the energy monitor to “talk” to smart thermostats or lighting systems.
-
Historical Benchmarking: Comparing current usage to the same month in previous years, adjusted for local weather data.
-
Safety Alerts: Notifications for unusual events, such as a stove being left on for over four hours or a sump pump running continuously.
Risk Landscape and Failure Modes
The “Smart Energy” ecosystem is not without significant vulnerabilities:
-
Data Privacy & Surveillance: High-frequency energy data is a proxy for human behavior. It can reveal when a house is empty, when inhabitants wake up, and even what television shows are being watched (via screen brightness fluctuations reflected in the load).
-
CT Saturation and Clipping: If the current transformers are undersized for the main service, they may “saturate,” leading to inaccurate readings during peak loads.
-
Firmware Obsolescence: As these are IoT devices, a manufacturer’s bankruptcy or a “forced” cloud update can render the hardware a “brick.”
-
Signal Noise: High-frequency interference from neighboring industrial equipment or poor grounding can degrade the accuracy of NILM disaggregation.
Governance, Maintenance, and Long-Term Adaptation
A telemetry system requires a “Review and Refine” cycle to maintain its authority as a decision-making tool.
Integrated Maintenance Checklist
-
Monthly: Review the “Unidentified Load” category. If it exceeds 20% of total usage, re-calibrate the appliance recognition software.
-
Biannually: Check the CT clamps for physical movement. Thermal expansion and vibration can occasionally loosen the clamps, leading to inaccurate readings.
-
Annually: Compare the monitor’s total kWh against the utility meter’s official reading. A variance of more than 5% suggests a calibration or voltage-reference issue.
As household appliances are replaced, the system must be “taught” the new signatures. An upgrade from an old AC unit to a modern variable-speed heat pump will completely change the electrical profile of the home, requiring a reset of the historical baseline.
Measurement, Tracking, and Evaluation
-
Leading Indicators: Real-time wattage peaks; frequency of “threshold alerts.”
-
Lagging Indicators: Total monthly kWh reduction; “Cost per Square Foot” compared to regional averages.
-
Qualitative Signals: Increased “energy literacy” of household members; decreased anxiety regarding utility bill fluctuations.
Documentation Examples
-
Load Profile Map: A visual “heat map” of energy use across a 24-hour cycle.
-
Appliance Health Log: A record of duty cycles for major motors (HVAC, Fridge) to track mechanical aging.
-
Solar ROI Tracker: A specific log of “Self-Consumption” vs. “Exported” energy.
Common Misconceptions and Oversimplifications
-
“It recognizes everything instantly”: NILM takes weeks to learn patterns and may never recognize low-wattage devices like LED bulbs.
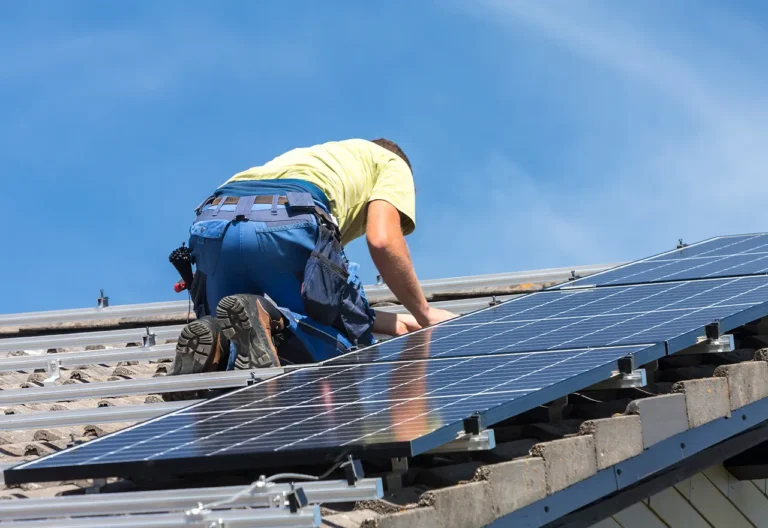
-
“I don’t need an electrician”: Opening a breaker panel is a high-voltage risk. Professional installation is a prerequisite for safety and insurance compliance.
-
“It saves 20% on my bill”: The monitor saves 0%. The user saves 20% by acting on the data.
-
“Smart plugs are just as good”: Smart plugs only monitor what is plugged into them; they cannot see hardwired loads like water heaters or stoves.
-
“The utility smart meter is the same thing”: Utility meters are designed for their billing, not your insight.
Ethical and Practical Considerations
There is a growing ethical debate regarding “Energy Equity.” As “Smart Energy Monitors” become standard in high-end “green” homes, there is a risk of creating an “efficiency gap,” where those with the least disposable income are stuck with the most opaque and inefficient energy systems. Furthermore, the reliance on cloud-based analytics raises questions about “Data Sovereignty”—who owns the signature of your life? Local-first processing, where data stays on a local server rather than the cloud, is an emerging practical adaptation for the privacy-conscious.
Synthesis and Future Adaptability
The trajectory of residential energy is moving toward the “Virtual Power Plant” (VPP). In this future, “Smart Energy Monitors” are not just passive observers; they are the communication nodes that allow a home to trade energy with its neighbors. The ability to monitor at the circuit level will be the difference between a home that is an “asset” to the grid and one that is a “liability.”
Ultimately, the mastery of energy telemetry is an exercise in mindfulness. It is about reconnecting the abstract concept of “power” with the physical reality of our daily habits. The systems we install today must be viewed as modular platforms—capable of adapting to new battery chemistries, changing utility regulations, and the inevitable evolution of the smart home.